Data, Analytics & Reporting
Turning raw data into actionable insight for learning design, operational improvement, and stakeholder reporting.
Power BI · PowerShell · Selenium · SurveyMonkey · Moodle Analytics · Arlo TMS · SharePoint · Kirkpatrick-Phillips Evaluation · Cambridge Spark Level 4 Data Analysis
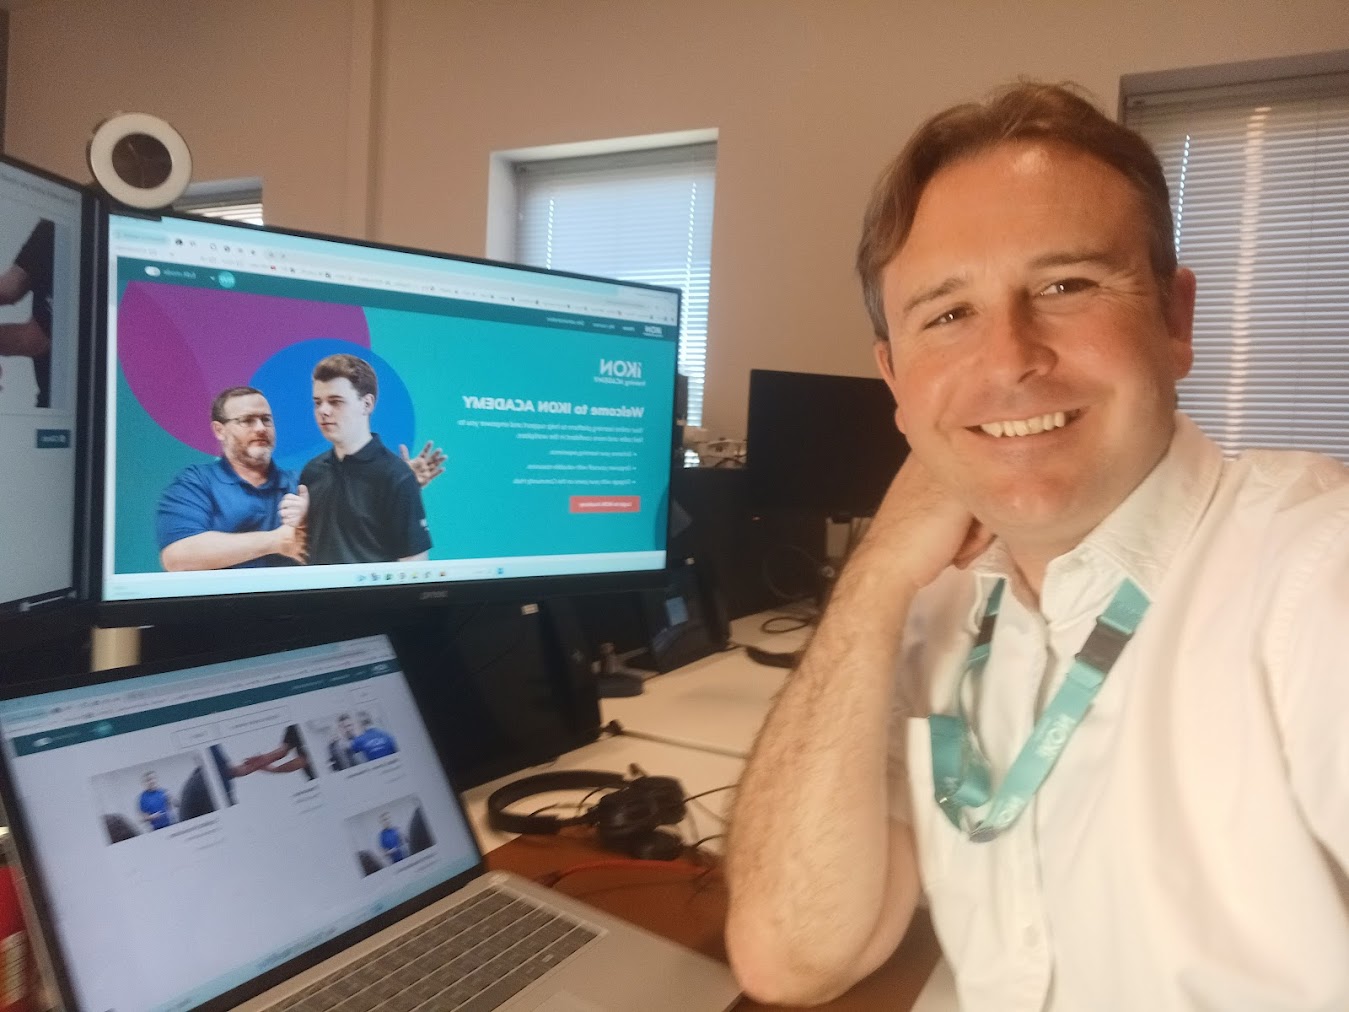
Analytics work spans two professional contexts - IKON Training (2022–24) and UCL STEaPP (2024–present) - with different tools, data sources and access permissions in each.
UCL STEaPP: Moodle Engagement Tracker (2026)
At UCL, direct Moodle API access is restricted to the central IT team. With UCL IT approval, I built an alternative: PowerShell scripts using Selenium-based web automation to scrape learner activity and completion data from Moodle course pages. Data is written into Dataverse, modelled across a structured entity set, and connected to a Power BI dashboard for programme teams.
The Architecture
- PowerShell scrapers with Selenium extract activity completion and last-access data from Moodle
- Data is written to Dataverse with a structured entity model (learners, modules, enrolments, activities, completions)
- A model-driven Power App provides an administrative interface for module configuration
- Power BI reads from Dataverse to provide a refreshable, stakeholder-facing dashboard
See the UCL STEaPP Moodle Engagement Tracker page for full system detail.
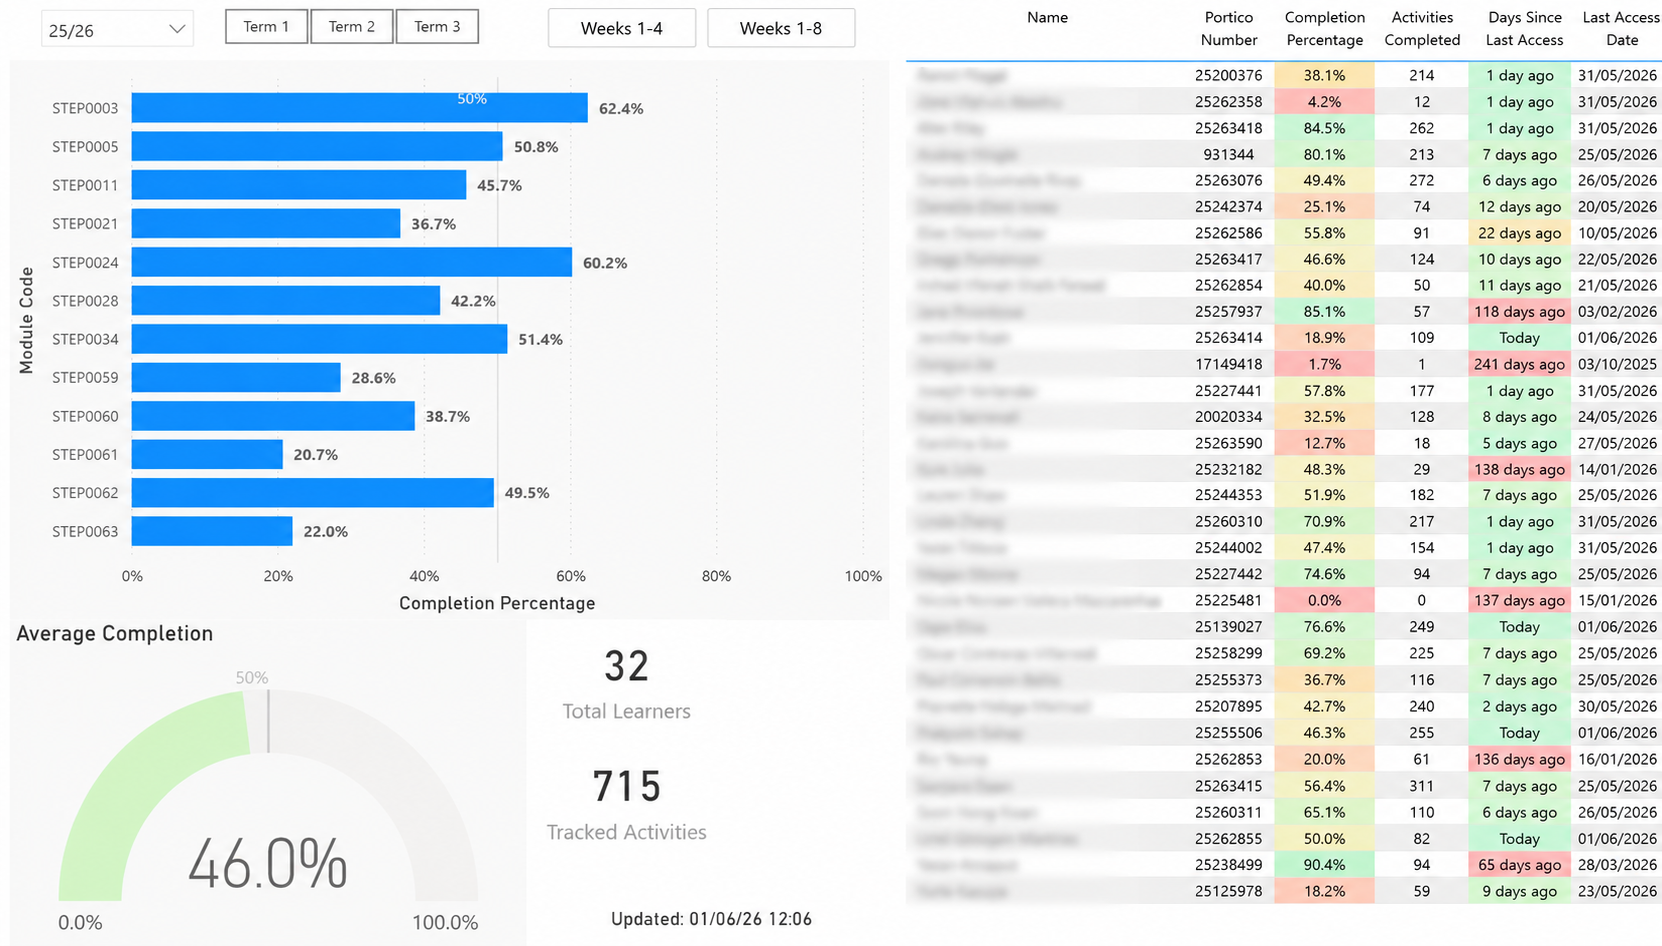
The Power BI reporting layer - module completion rates and engagement overview for UCL STEaPP programme teams.
IKON Training: Attendance, Learner Analytics & Feedback (2022–24)
At IKON, I had site administrator Moodle access, meaning learner data could be extracted directly via API calls. I built a Power BI and PowerShell-based attendance monitoring system - scheduled data extraction feeding into dashboards that gave operational staff a real-time view of attendance patterns and engagement metrics. Tracking time-on-task within Moodle revealed patterns not visible through completion rates alone: high dwell times in specific sections prompted targeted improvements to content clarity and navigation.
Attendance Dashboard
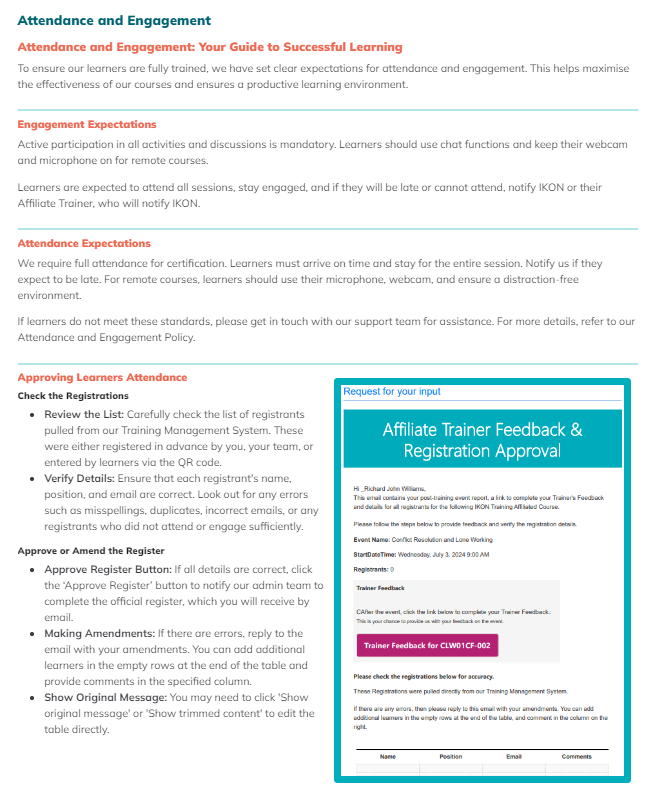
Attendance and engagement overview - designed to surface patterns and flag learners requiring follow-up.
Learner Time Tracking
Average time on platform, broken down by pre-course and post-course activity - used to inform course design decisions.
Feedback Analytics & Kirkpatrick-Phillips Evaluation (IKON, 2022–24)
I redesigned IKON's end-of-course survey using the Kirkpatrick-Phillips methodology - moving beyond satisfaction scores (Level 1) to capture learning (Level 2), intended behaviour change (Level 3), and perceived organisational impact (Level 4). This involved presenting to weekly team meetings, proposing changes to survey question design, and implementing across the full course portfolio. The result was a feedback instrument that supported ROI conversations with clients.
SurveyMonkey Integration
SurveyMonkey was integrated into the broader automation ecosystem via Power Automate - using both the native connector and a custom API integration. Learner feedback data was used to monitor trends across the course portfolio, identifying dip-points and feeding findings back into content and delivery design cycles.
Interactive Visualisation: Feedback Analysis (IKON)
An interactive Bokeh visualisation built to explore learner feedback patterns over time - by date, course type, trainer and satisfaction dimension. Built as a project for the Cambridge Spark Level 4 Data Analysis qualification, demonstrating applied data analysis in a real professional context. The data preparation and analysis used pandas for manipulation and exploration, with Matplotlib and Seaborn for exploratory visualisation before building the final interactive output in Bokeh.
Note: The automation refreshing this chart with new data was discontinued after leaving IKON Training. The visualisation reflects data from that period.
The interactive chart opens as a standalone page - built with Python and Bokeh, filterable by date, course type, trainer and satisfaction dimension.
Open Interactive Feedback Chart ↗For more detail on the full UCL learning analytics pipeline, see the UCL Moodle Engagement Tracker. For the automation infrastructure that generates this data, see Workflow Automation & Solution Engineering. For AI integrations within the data pipeline, see AI for Learning & Assessment.