UCL STEaPP Moodle Engagement Tracker
A bespoke monitoring and evaluation system combining automated Moodle scraping, Dataverse, Power Apps and Power BI to make learner engagement visible and actionable.
PowerShell · Selenium · Dataverse · Power BI · Power Apps (Model-Driven) · SharePoint · Power Platform · Moodle API · UCL STEaPP
My Role
I designed and built this system end-to-end: scoping the problem with programme teams; designing the Dataverse entity model; writing the PowerShell and Selenium-based scraping scripts; building and configuring the model-driven Power App admin interface; developing the Power BI dashboard measures, visuals and filters; investigating and resolving data quality issues (including suspended learner handling and learner-count discrepancies); configuring SharePoint and Power BI access permissions; and writing the full system documentation and maintenance guide.
The work was carried out with UCL IT awareness and approval of the Selenium-based approach, where direct Moodle API access is restricted to the central IT team. Programme team stakeholders provided requirements, reviewed dashboards and validated data - all build and technical decisions were mine.
System Architecture
UCL Moodle → PowerShell Scrapers → Dataverse Tables → Power BI Dashboard → SharePoint / Power App Access
The scraper pipeline runs three sequential stages in a single shared Chrome/Selenium session: (1) Activity Report - collects Moodle activity structure and engagement information; (2) Activity Completion - records per-learner completion status for each activity; (3) Last Access - gathers each learner's last access date and time across all active modules. The orchestrator writes a Scraper Run record and structured Scraper Run Log entries to Dataverse; a Power Automate flow watches the Scraper Run table and requests a Power BI semantic model refresh when the pipeline completes. The package is distributed via a controlled SharePoint site and includes a PowerShell 7 bootstrap installer with portable fallback for managed devices, automatic ChromeDriver version matching, and scheduled Windows task configuration.
Instead of new spreadsheets or Lists for each academic year, the Dataverse model uses a consistent entity set - Academic Year, Term, Module Offering, Learner, Enrolment, Moodle Activity, Scrape Run, Activity Completion, Last Access Snapshot. New years become new data in the same model, not a new data source.
End-to-end pipeline: Moodle scraping - Dataverse storage - Power BI reporting - SharePoint and Power App access.
The Engagement Dashboard
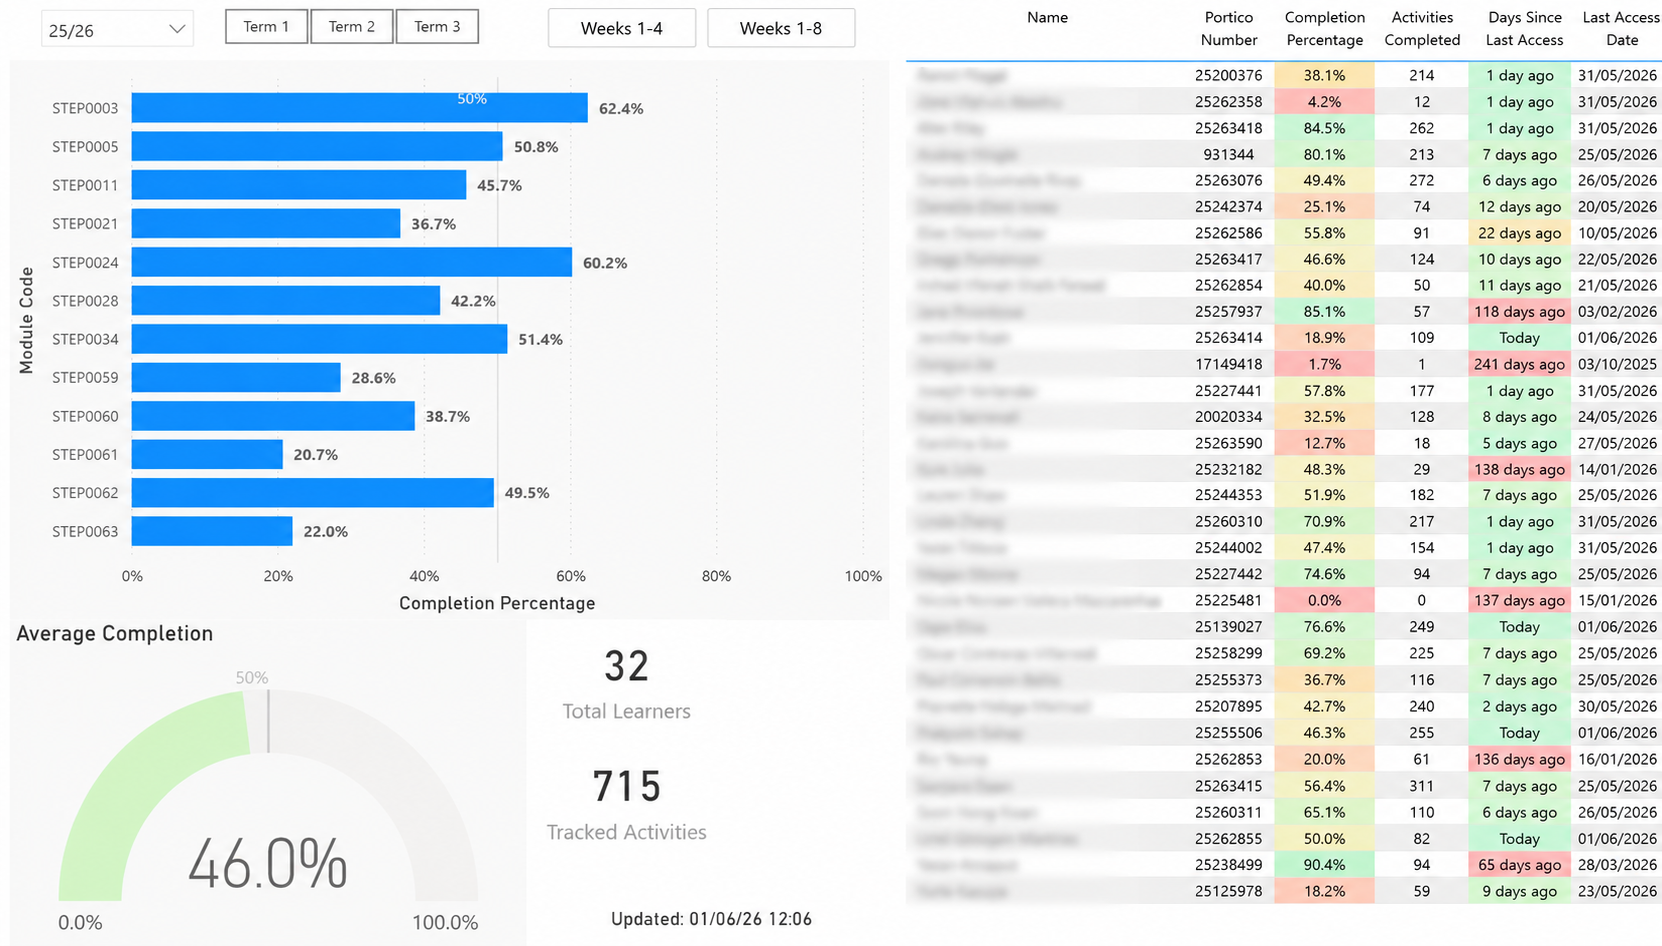
Completion rates per module and per learner. Learner names redacted for publication.
Power Platform Dashboard
The Activity Tracker Power Platform dashboard - module management, active scrape scope and engagement metrics.
What the System Tracks
Module level: course metadata, academic year/term grouping, activity types (Page, Forum, Quiz, Database, Board), completion percentages, and whether the module is currently in the active scrape scope.
Learner level: name, enrolment status, last access date and time, per-activity completion records, and a calculated completion percentage. Suspended learners are retained in the model for audit purposes but excluded from active headcounts.
Dashboard answers: Which activities are being used? Who hasn't engaged recently? What is the overall participation picture for the cohort?
Dataverse Data Model
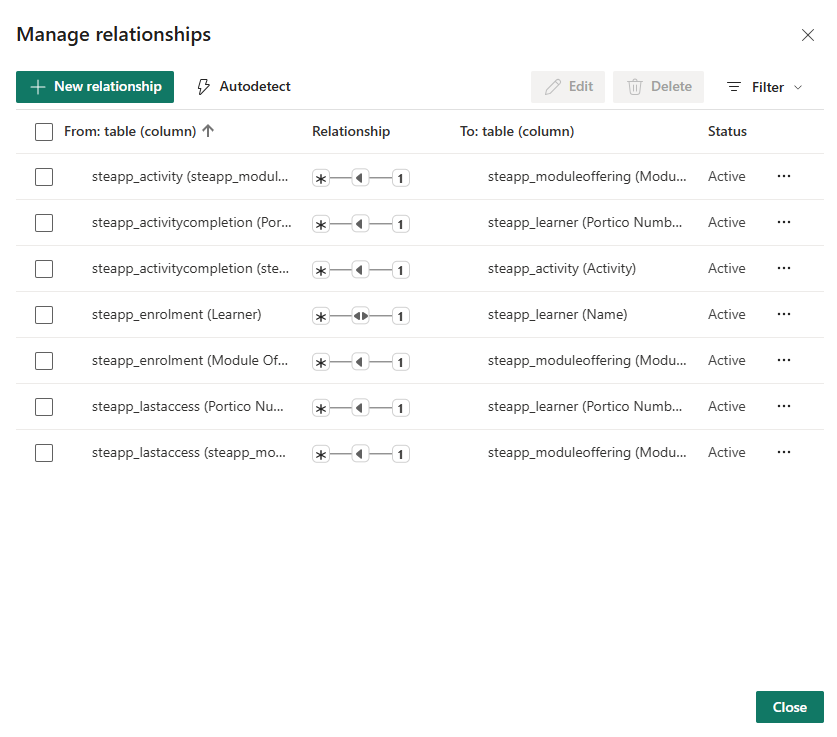
Seven active relationships linking activities, completions, enrolments, learners, last access and module offerings.
Power BI Dashboard
Visuals include:
- Total and active learner counts by module
- Completion by module (bar chart, sortable by name or completion %)
- Completion by learner (filterable by module)
- Term-based filtering and activity type breakdown
- Detailed learner/module data tables
Key technical decision: headline learner counts are based on enrolment records, not the activity completion table - so learners with no recorded completions but who are genuinely enrolled are included in programme-level totals. A wrong measure produces a plausible-looking number that quietly misrepresents the truth.
Model-Driven Power App
An administrative interface for managing module scope without direct Dataverse access. Supports: adding and reviewing module offerings; marking which modules are active for scraping; managing Moodle course IDs and URLs; reviewing learner and enrolment records.
The model-driven Power App admin interface - managing module offerings and active scrape scope.
Power Automate - Nested Loop Pipeline
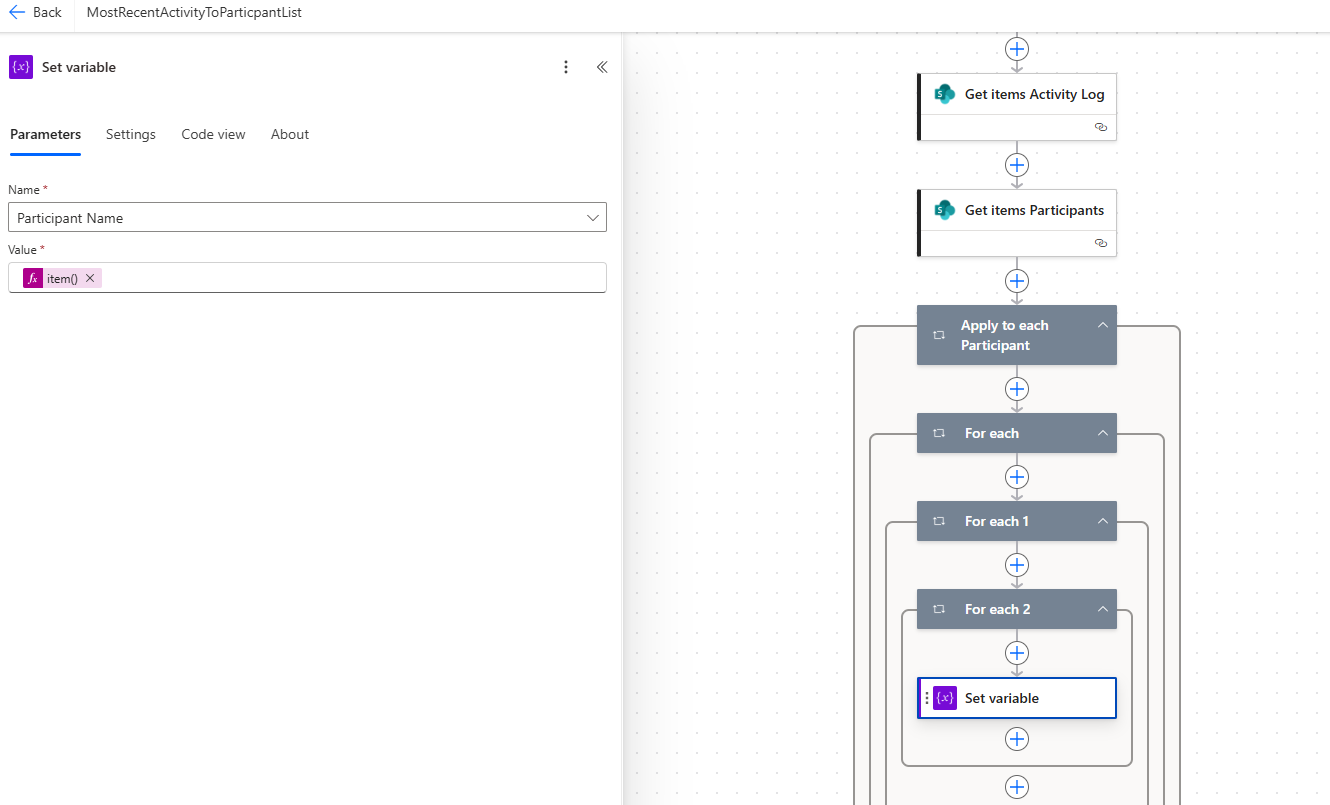
Nested loops across activity log and participant records, pulling data from SharePoint into the tracking pipeline.
Power Automate - Filter & Compose Operations
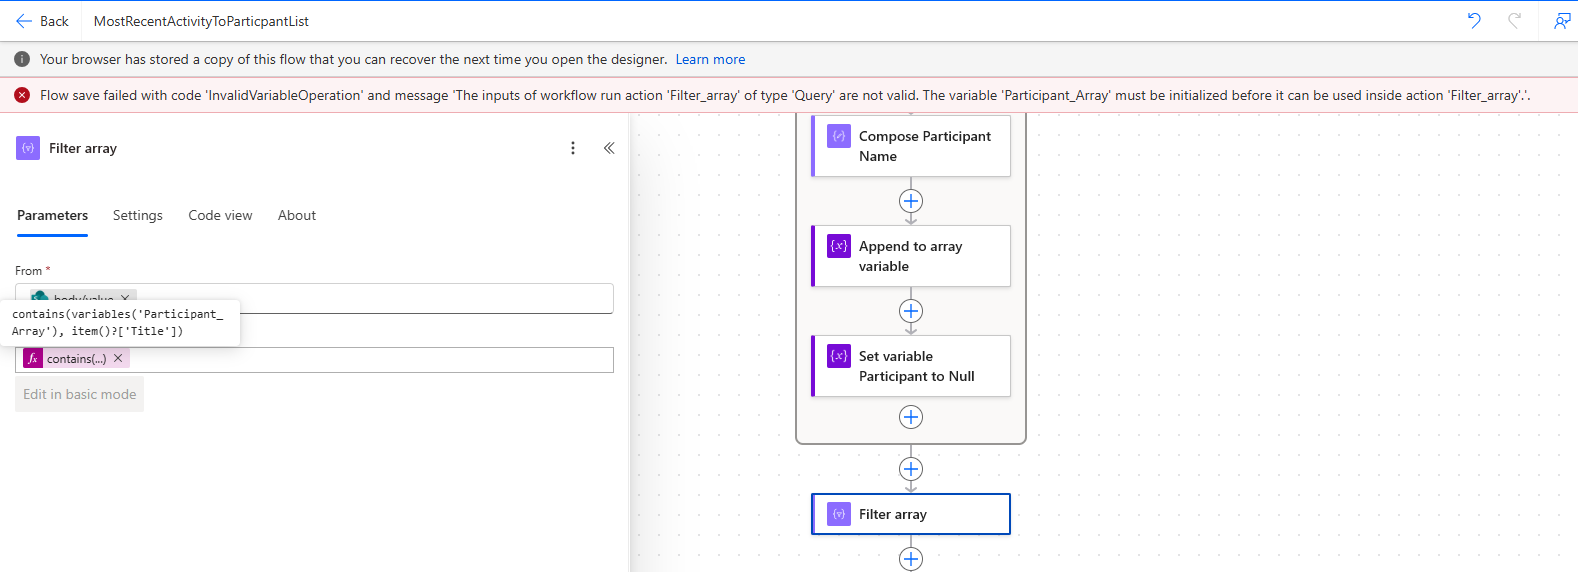
Filter array with a contains() expression - processing participant arrays and composing structured output.
Skills Demonstrated
PowerShell scripting Selenium web automation Dataverse data modelling Power Platform architecture Model-driven app configuration Power BI dashboard development DAX measure design Moodle data extraction Learning analytics design Data pipeline architecture Data cleaning and validation Permissions and governance Technical documentation Stakeholder reporting
For more on the automation infrastructure, see Workflow Automation & Solution Engineering and Data, Analytics & Reporting.