Interactive Analytics Demos
From spreadsheet to explainable, interactive insight. Two dashboards you can open and use now.
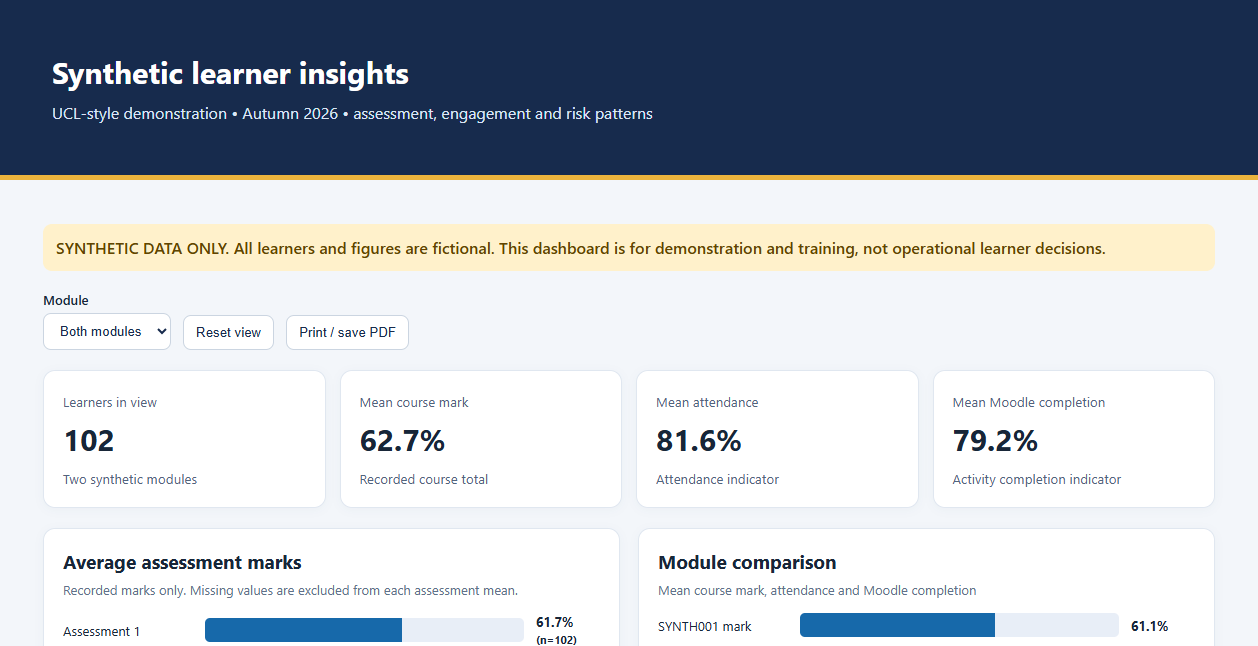
All learners, buildings and figures in these demos are fictional.
Microsoft 365 Copilot · Excel · HTML · JavaScript · Data quality · Learning analytics · Synthetic data
Why I Built These
Most of my analytics work cannot be shown in public, because it contains learner names and engagement records. These demos show the same thinking with safe data: start from a messy spreadsheet, decide what questions it can honestly answer, deal with the data-quality problems in the open, and give a non-technical reader controls they can understand.
I use them in my Copilot workshops to show what is possible in an hour, and where a person still has to check the work.
Synthetic Learner Insights
102 fictional learners across two made-up modules. The dashboard brings together assessment marks, attendance and Moodle completion, and lets you switch between modules.
- Missing marks are excluded from each average, and each chart says how many learners it is based on
- Whole-cohort summaries are kept separate from a small set of illustrative learner profiles
- Notes explain what each measure can and cannot tell you
Estates Work-Order Dashboard
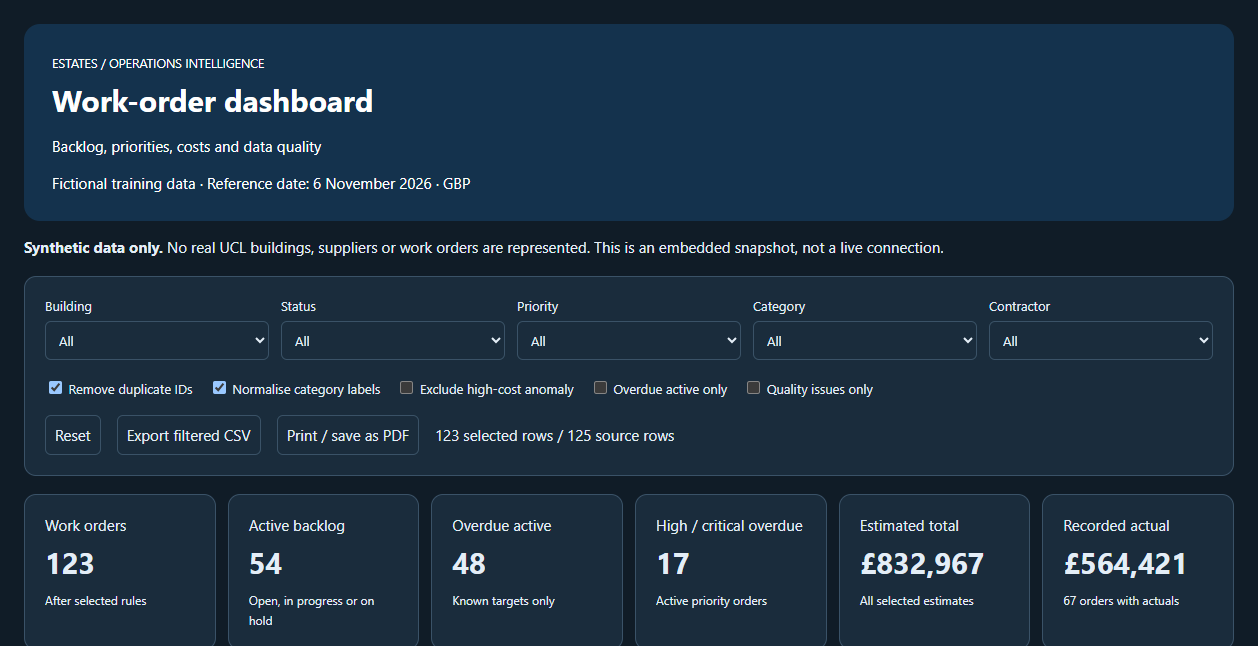
125 fictional work orders with problems planted in the data. Filter by building, status, priority, category or contractor, and export what you have filtered.
- Switches let you remove duplicate IDs, normalise inconsistent category labels and exclude one extreme cost, so you can see how each fix changes the totals
- The page always shows how many source rows are in view
- Works with a keyboard, in light or dark mode, and prints cleanly
Built for my Copilot sessions for UCL AI Pathfinders.
How They Were Made, and My Part in It
I generated the synthetic datasets, decided which questions each dashboard should answer, and wrote the instructions. Microsoft 365 Copilot produced the first version of each page. I then checked the figures against the source workbook, corrected what did not reconcile, and refined the wording and controls until a non-specialist could use them without help.
I say this plainly because it is the point of the exercise. AI made the first draft fast. The specification, the checking and the judgement about what is safe to claim were mine.
The Real Thing
For analytics work on live data, see the STEaPP Activity Tracker, a Moodle engagement-reporting service built on Dataverse and Power BI, and Data, Analytics and Reporting.